Main Display
At the top of the display is a Launch Options button. This button opens a pop up window with ways to launch a new program. Each tab is named based on the application and ranks it opens. On the top right is a series of buttons for debugging:run, continue, pause, next, step, out.
Launch Options
There are 2 options for launching an application.
Full Launch - fill out the “Application Path” field and any other necessary fields and press the “Launch App” button.
ORQuick Launch - paste a gdb4hpc launch command into the quick launch row and press the “Load Binary” button.
For example:
launch $App0{10} ./myApp --launcher-args=--exclusive --args=10
Terminals
The terminal on the left is the user terminal. You can use this terminal for user interactions with gdb4hpc by typing in gdb4hpc commands directly in here.
The middle terminal will display any errors or warnings received during the session.
On the right is the program terminal and will display any program output.
Source Code Display
The middle section of the screen displays the source code. The current line in the file will be highlighted. You can interact with the source code to set breakpoints and get current variable values.
Right Side Panel
The right side panel provides extra ways to interact with the gui. Each section of this panel is described below.
Threads
Thread information is displayed including the thread’s current file and function. The current thread is marked with a selected label.
PE Sets
This section allows you to see the lists of pe sets. The pe set in focus is marked as selected. You can choose a different pe set to focus on by pressing the select button. A new tab can be opened for each pe set describing an individual application. This new tab will display the source code location for the specific pe set as well as any other information specific to that pe set.
Breakpoints
To set a breakpoint, you can click on the line number that you would like to break on in the source code panel and you can delete it by pressing on the line number again.
After a breakpoint is created, it will be displayed under the breakpoint section of on the right side. You can enable and disable each breakpoint by toggling its checkbox.

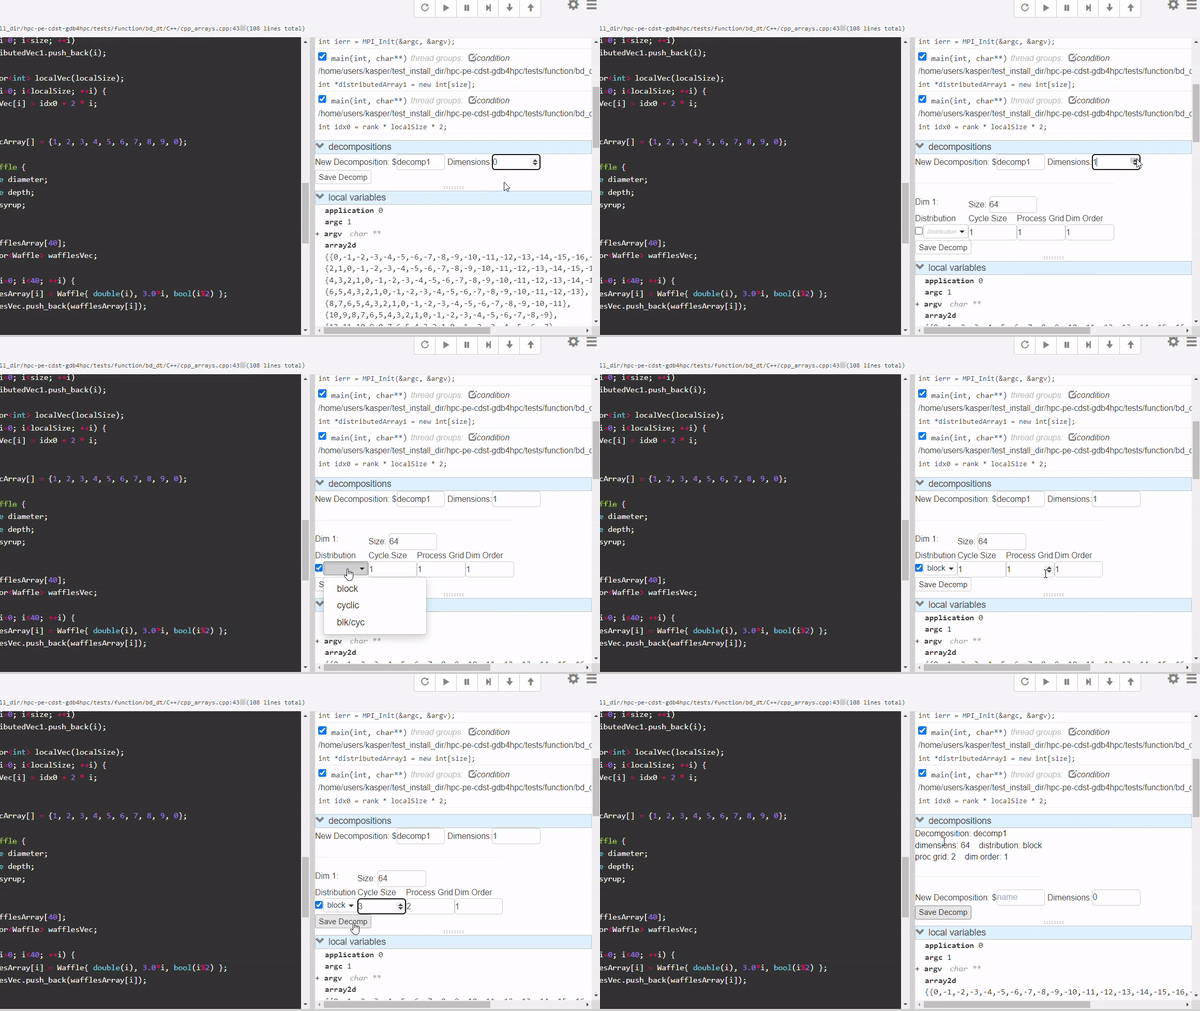
Decompositions
To create a decomposition, add a name and choose a number of dimensionsin the decomposition section. For each dimension, new fields will appear to let you choose the size, distribution, cycle size, process grid, and dimension order.
Once all of the necessary fields are filled out, save the decomposition.

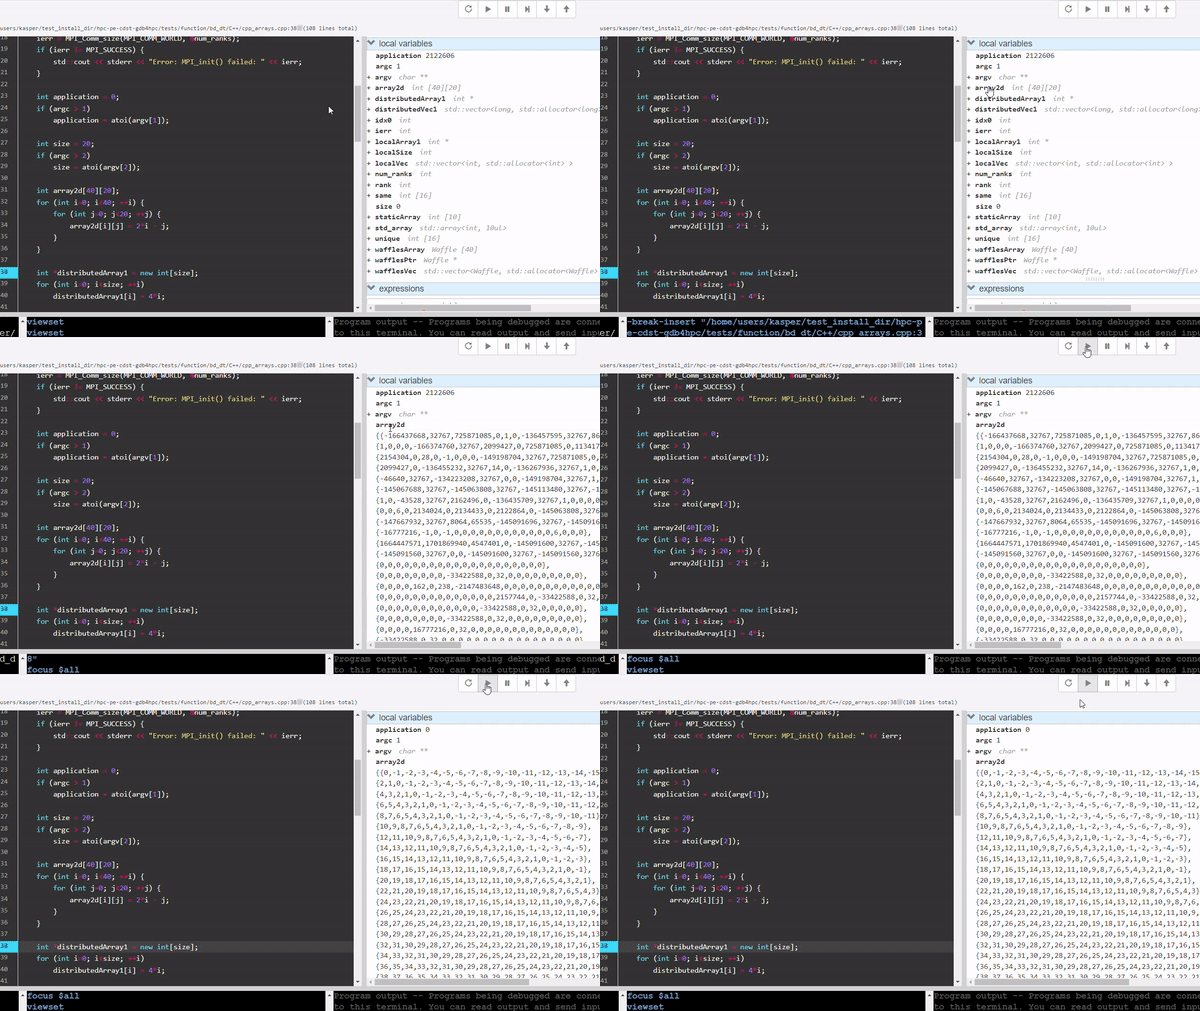
Local Variables
Local variables will appear here. You can continue to track the value of a variable by clicking the +.

To quickly view the value of a variable, you can hover over the variable in the source code panel where a popup with the value will appear.

Expressions
In this section, add a custom variable or expression to track.

Compare
This section is used to create compare commands for gdb4hpc. You can create a comparison in two ways.
You can write a comparison out and press enter or use the Add button.
You can use the dropdowns to select values for each field and click the Add button.
When you click the Compare button. All of the comparisons in the list that are enabled will be run. Toggle a comparison off if you do not wish to run it.

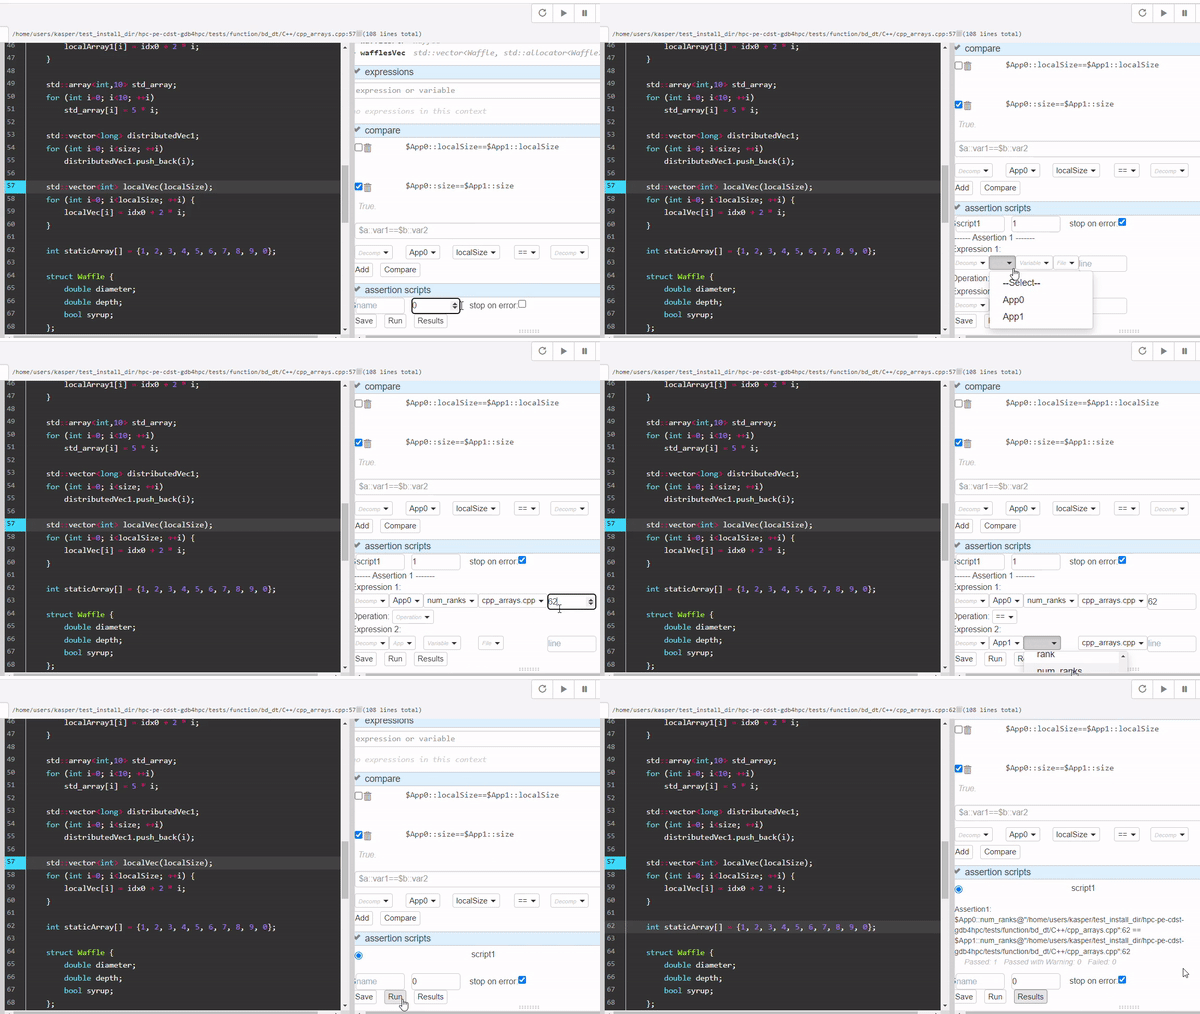
Assertion Scripts
In this section, make sure to give your script a name and select how many assertions to include in the script. You can toggle the stop on error check box to ensure the program stops executing if an error is received.
For each assertion in the script, fill out the fields for Expression 1, Operation, and Expression 2. Once everything is filled out, select the Save button. This will save the script and add it to the list.
Choose an assertion from the list to run by selecting its radio button. Then click the Run button. Once it is done running, click on the Results button. This will update the display with the results of the run.
