CPE Cassini Performance Counters User Guide
About HPE Cray Cassini hardware performance counters
The CPE Cray Cassini Performance Counters User Guide provides details on how to use counters built into the Cassini Network Interface Card (NIC) to collect and analyze performance data. This guide includes procedures for using HPE Performance Analysis Tools running on HPE Cray Supercomputing EX systems.
See the HPE Performance Analysis Tools User Guide (S-8014) for additional and related information.
Scope and audience
This publication is intended for use by users needing to collect and analyze performance data utilizing the HPE Cray Cassini performance hardware counters.
What is Cassini?
HPE Cassini performance counters are a set of hardware counters provided by the HPE Cassini NIC. The HPE Cassini NIC resides in HPE Slingshot-11, a high-performing interconnect designed for HPC and AI clusters, and the Slingshot switch. HPE Cassini performance counters count hardware activities relative to the HPE Cassini NIC on HPE Slingshot. The HPE Cassini NIC, a 200 Gbps NIC, provides fast Message Passing Interface (MPI) message passing rates, increased bandwidth, and unlimited scalability.
Features and Benefits
The HPE Cassini NIC:
Uses an Ethernet wire protocol which enhances cluster usage capabilities.
Connects to the network using four-lane Ethernet link that operates at 56 Gbps/lane using PAM-4 signaling or 28 Gbps NRZ, providing 200 Gbps or 100 Gbps.
Connects to a CPU or GPU using a x16 PCIe Gen4 host interface operating at 16 GT/s in each direction.
Accelerates HPC and AI performance by:
Freeing up host memory bandwidth and CPU resources, reducing compute overhead for GPU-initiated communications, and
Integrating technology to detect key packet information.
Provides high performance for MPI messaging, remote memory access (RMA) access in partitioned global address space (PGAS) programming models and over the Ethernet.
Exposes remote direct memory access (RDMA) and HPC optimized features to software using the Libfabric software interface.
HPE Cassini performance counters that are integrated with the Slingshot NIC allow you to:
Analyze application performance, including various counters for:
Debugging application performance problems
Determining whether the network is causing low or fluctuating performance between runs
Identifying details regarding the impact of any lost packets
Count anomalous or erroneous events
Fine-tune applications in more efficient and effective ways.
HPE Cassini Performance Counter Access and Event
HPE Cassini performance counters are accessed through the PAT_RT_PERFCTR environment variable and other related environment variables. HPE Cassini performance counter events are collected by processor zero on each socket upon which an application is scheduled and executing. See the HPE Performance Analysis Tools User Guide (S-8014) for additional and related information.
Traffic, Commands, Payload, and Event Handling
Cassini implements a set of blocks, including command queue blocks, that process commands into packets, track their state, execute packets, and manage completion. Each Cassini block used to implement a path collects counter data on its operation. Request or response traffic follow a distinct process involving endpoints and data exchanges across a high-speed network (HSN). Generally, endpoints initiate data exchange across the HSN by generating packets. Packets travel across the HSN to the targeted destination endpoint. The destination endpoint acts on a request and returns a response packet after successfully receiving the request packet.
Specifically, commands, along with their headers that describe inload payload data, are written to the memory queue, and afterwards, depending on whether NIC space is available, the command is executed or read from the queue later. The HPE Cassini NIC:
Reads command queue data in blocks of up to 256 bytes, and
Supports 1024 transmit command queues for sending data and 512 target command queues for posting receive buffers.
The NIC writes back queue status information periodically and delivers status details on events, such as errors. Systematically, the:
System transfers commands from the host to the NIC processor interface and then, to the command queue.
Command queue validates one or multiple commands, passing them to an outbound transfer engine (OXE).
OXE packetizes commands.
OXE sends packets to the link, if required.
Packet connection and tracking (PCT) block manages the state and matches responses to their original requests.
Counters that provide related performance information are associated with each of these systematic steps.
On the receiver side, the:
Inbound traffic engine (IXE) processes incoming packets.
Resource management unit (RMU) validates packets, determining target endpoints.
Packet buffer holds packet data.
System sends headers to the list processing engine (LPE) for matching. Note that:
a. Write requests and atomic memory operations (AMOs) are passed to a write DMA engine if a header is matched to a target buffer. b. Read requests are passed to an outbound transfer engine and processed for responses. c. Initiator and target complete queues are managed by an event engine.
Counters that provide application performance information are associated with each receiver step.
HPE Cassini NIC connection states and the retry handler (RH) are key components that assist in tracking network errors and detecting and recovering lost packets in the network. The Cassini NIC tracks information on network error handling so that applications can determine whether performance variations are due to errors. The NIC tracks the state necessary to detect and recover from packet loss in the network. The system invokes the retry handler whenever packets are dropped or a negative acknowledgement (NACK) is returned by the target NIC. The retry handler maintains a set of counters, and these counters are accessed through /run/cxi/csi<d>/. HPE Slingshot links protect against errors using link level retry (LLR), and there are counters to show how often it is used.
Packet, Flit, and Stall Counters
At points within the HPE Slingshot NIC, separate counters are provided for each set of packets, flits, and stalls.
Flit Counters
With HPE Slingshot, data is transferred between devices in packets that contain up to 4,096 bytes of payload data (or up to 9,000 bytes for jumbo ethernet packets). Within the NIC, data is moved around in 64-byte flits at a rate of one flit per cycle of 1 GHz clock.
Counter Stalls
Stalls, in most cases, are an indication of flow control back-pressure, limiting the rate at which flits can be forwarded across an interface. A stall counter increments each flit-time that a ready-to-forward flit is prevented by back-pressure from doing so. For example, if interface flit and stall counts increment at equal rates, then, on average, flits cross the interface at half the rate they would if no stalls occurred. Situations that lead to stalls include, for example, rate adaptation to a lower speed downstream interface and arbitration, at a point downstream, for a contended resource. A high ratio of stalls-to-packets or stalls-to-flits is an indication of possible congestion. Blocked counters are included at some arbiter inputs within the HPE Slingshot NIC interconnect. Typically, these blocked counters would increment whenever a flit is available at the input, but arbitration, instead, selects a different input.
Key NIC performance counter groups
There are 12 unique Cassini counter groups:
Name |
Counter Group |
|---|---|
|
|
|
|
|
|
|
|
|
|
|
|
|
|
|
|
|
|
|
|
|
|
|
The above listed groups (which are accessed by setting PAT_RT_PERFCTR to the name of the group) combine a set of counters optimized to provide specific and unique types of performance information. A subset of some of these groups are comprised of multiple counter events that provide useful metrics if grouped together. This subset of groups serves as a starting point for investigating the application performance using Cassini. They provide information on the amount of traffic generated by the NIC, whether that traffic is being slowed down by address translation and back pressure from the host, and whether that traffic is causing congestion.
There are 1,427 unique Cassini counter events that can be assessed individually by setting PAT_RT_PERFCTR to the name of one or more events. See the cassini(5) man page for additional information.
CxiPerfStats - traffic congestion counter group
Use CxiPerfStats counters as a starting point for investigating application performance details. CxiPerfStats counters provide information on the amount of traffic generated by the NIC, regardless of whether the traffic is slowed down by address translation and back pressure from the host or whether that traffic is causing congestion issues.
Counter Name |
Description |
|---|---|
|
Number of packets sent in traffic class |
are 0 for request and 1 for response. |
|
|
Number of packets received in traffic class |
classes are 0 for request and 1 for response. |
|
|
Number of cycles in which the transmit path is paused for traffic class |
|
|
this endpoint is supplying data faster than the network can deliver it. |
|
Divide by 1E9 to determine the proportion of time paused. |
|
|
Number of cycles in which the pause is applied on the receive path for traffic |
class |
|
that the network is supplying data faster than this endpoint can consume it. |
|
Divide by 1E9 to determine the proportion of time paused. |
|
|
Number of PCIe packets transferred using the posted path (for example, writes), |
|
and the number of cycles in which this path is blocked. Compute |
the ratio |
|
indicate back pressure from the host. This endpoint is likely to be the cause |
|
of congestion. |
|
|
Number of PCIe packets transferred using the non-posted path (for example, |
|
reads), and the number of cycles in which this path is blocked. Compute |
the ratio |
|
per host performance (high read latencies). This endpoint is likely to be |
|
injecting at a low rate. |
|
|
Number of messages matched on the priority list (or receive was posted |
before the message arrived). Four counters of which 0 is the default. These |
|
messages incur lower cost because data is written directly to the user buffer. |
|
|
Number of messages where payload data was delivered to a buffer on the overflow |
list because there was no match on the priority list. Four counters of which 0 |
|
is the default. These messages incur higher cost because data must be copied |
|
from the overflow buffer. |
|
Compute the ratio |
|
porportion of messages for which receives were posted in advance. |
|
|
Number of misses in the NIC translation cache. Four counters of which counter 0 |
counts misses on 4K pages and counter 1 counts misses on 2M pages by default. |
|
|
Number of times a tag was evicted from the NIC translation cache to make room |
for a new tag. |
|
CxiErrStats - Cassini network error counter group
Cassini provides a reliable transport for libfabric. If packets are dropped in the network, they are automatically retried. The retry handler is also invoked when there is resource exhaustion in the target NIC. Retransmission can have an impact on performance, especially in a tightly coupled application.
When low performance or variation in performance between runs is observed, use the CxiErrStats counter group to determine if the network is a factor. The counters in this group are:
Counter Name |
Description |
|---|---|
|
Number of response timeouts (or packet loss in the network). |
|
Retry handler is invoked. |
|
Number of resource exhaustion NACKs. Retry handler is invoked. |
|
|
|
|
|
Number of retries. |
|
Number of NACKs dropped. Retry handler is invoked. |
|
Number of uncorrected code words received on the switch to NIC link. High |
rates (multiple errors per second) indicate a poor quality link. |
|
|
Number of LLR replays. High rates (multiple per second) indicate that the LLR |
|
mechanism is providing protection on a poor quality link. |
CxiOpCommands - Cassini operation (commands) counter group
Cassini counters categorized as operational counters (relative to commands and packets) include:
Counter Name |
Description |
|---|---|
|
Number of commands of each type: |
- Put, Get, rendezvous, atomics, small message, Ethernet, etc. |
|
- Target commands |
|
- Triggered operations |
|
Excluding the |
|
sending of packets. Specifically, these commands include: |
|
- |
|
- |
|
- |
|
- |
|
- |
|
- |
|
- |
|
- |
|
- |
|
- |
|
- |
|
|
Both CQ commands (FENCE and LCID) and target commands: |
- |
|
- |
|
- |
|
- |
|
- |
|
delete it, if found. |
|
- |
|
- |
|
|
Number of DMA commands. |
|
Number of immediate data commands. |
Example

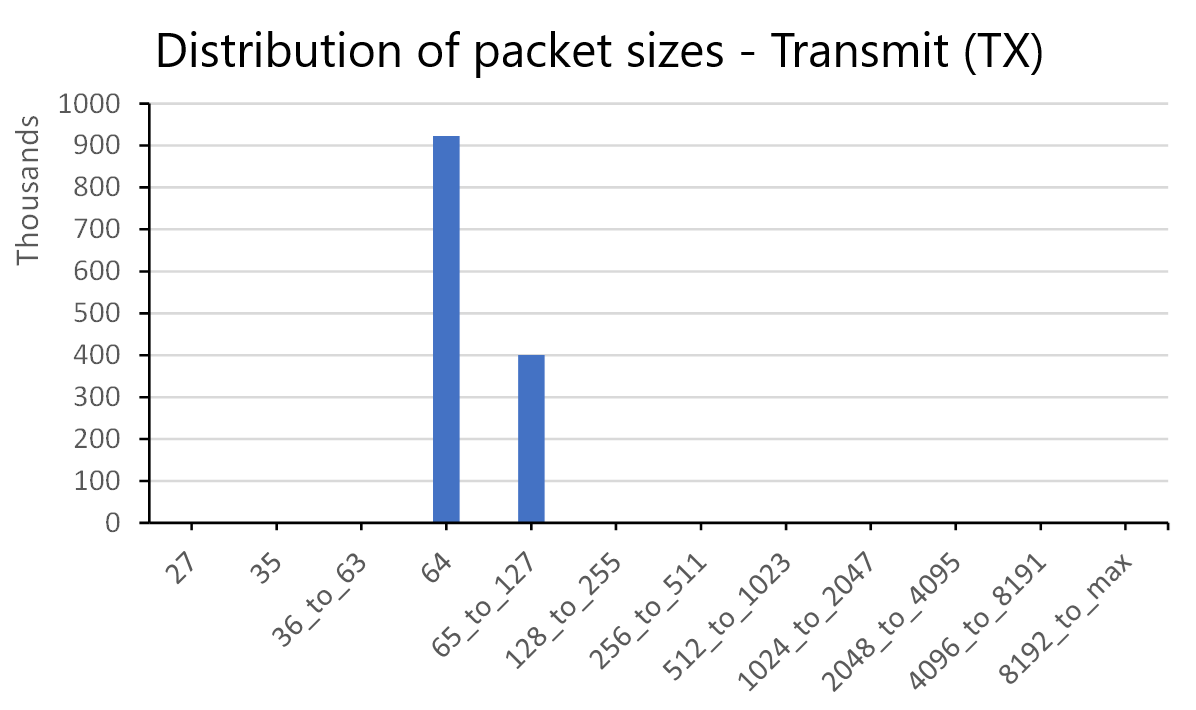
CxiOpPackets - Cassini operation (packets) counter group
Operational counters in this group include:
Counter Name |
Description |
|---|---|
|
Number of packets sent in each of 12 size bins: |
- Small packets 27, 35, 64 bytes |
|
- 65-128, 256-511, 512-1023, 1024-2047, 2048-4095, 4096-8191, 8192-Max |
|
|
Number of packets received in each of 12 size bins. |
|
Number of packets sent in each traffic class; default classes or 0 and 1. |
|
Number of packets received in each traffic class; default classes or 0 and 1. |
Examples

CxiDmaEngine - Cassini DMA engine counter group
CxiDmaEngine are categorized as counters that provide DMA engine information. Expect high values in the stall counters when the load is high. Compare against the clock for percentage of time stalled.
Counter Name |
Description |
|---|---|
|
Number of flits sent by each MCU (configurable to count packets or messages). |
|
Number of cycles in which available bandwidth is not used. |
|
Number of requests to DMA write controller. |
|
Number of stalls due to no posted credits (cycles). |
|
Number of stalls due to no non-posted credits (cycles). |
|
Number of memory read TLPs (all source). |
|
Number of memory write TLPs (all source). |
CxiWritesToHost - Cassini writes to host counters
The counters in this group are:
Counter Name |
Description |
|---|---|
|
Number of PCIe packets transferred using the posted path (for example, writes), |
|
and the number of cycles in which this path is blocked. Compute the ratio |
|
|
pressure from the host. This endpoint is likely to be the cause of congestion. |
|
|
Number of PCIe packets transferred using the non-posted path (for example, |
|
reads),and the number of cycles in which this path is blocked. Compute the |
ratio |
|
per host performance (high read latencies). This endpoint is likely to be |
|
injecting at a low rate. |
Example
In this example, note that:
The ratio calculation is cycles blocked per packet.
Cassini is being blocked for 20 cycles per 512-byte PCIe packet.
Size         Bandwidth (MB/s)
...
16384                  21070.06
32768                  21752.80
65536                  22896.48
131072                 23461.53
262144                 23764.63
1048576                23985.48
2097152                24024.32
4194304                24044.25
8388608                23972.08
(16777216)*          (20321.26)*
(33554432)*          (16550.01)*
(67108864)*          (16043.86)*
524288                 23917.26
Name                               Samples   Min         Mean          Max

hni_rx_paused_0                          4     0            0            0

hni_rx_paused_1                          4     0    396666167    158664669

hni_tx_paused_0                          4     0            0            0

hni_tx_paused_1                          4     0    163578075    654312300

parbs_tarb_pi_non_posted_pkts            4     0     54988998    201652661

parbs_tarb_pi_posted_blocked_cnt         4     0    941671854 (3766687419)*

parbs_tarb_pi_posted_pkts                4   372     46139681    184554415
* - Text in parentheses followed by an asterisk is red text in actual output.
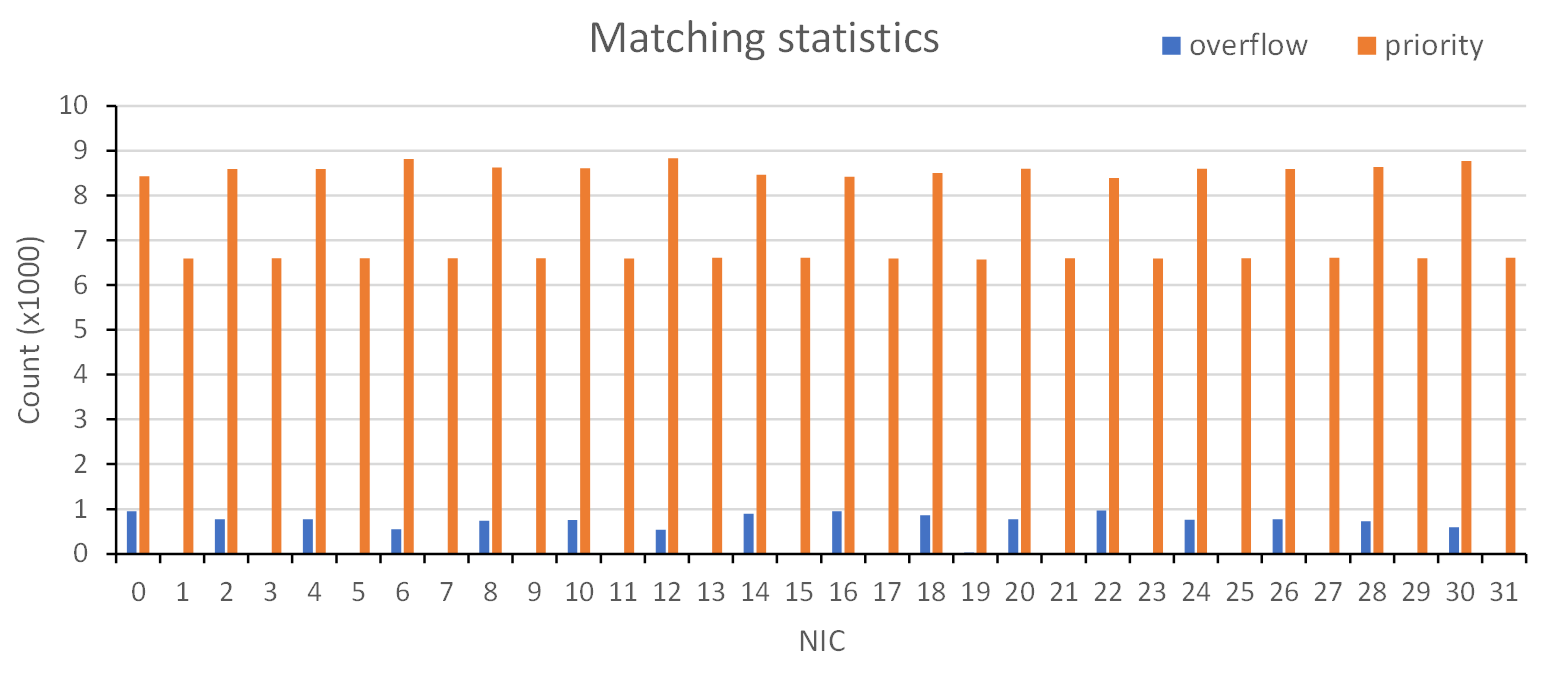
CxiMessageMatchingPooled - Cassini message matching of pooled counters
Counters in this group provide information on:
Inbound match counters, including tries, success, fails, longest lookup (in the number of entries), and number of match attempts calculated by averages
Successful matches subdivided by used once matches, locally managed matches, and persistent matches
Local operation counters per command (tries, success, fails, longest lookup, number of match attempts calculated by averages)
The number of wildcard searches (
NID== NID_ANY,PID++PID_ANY,RANK==RANK_ANY)Total rendezvous and offloaded rendezvous
Fetch information for
AMOcommands received
Counters in this group include:
Counter Name |
Description |
|---|---|
|
Number of requests matched. |
|
Number of messages matched on the priority list (receive was posted before the message |
arrived). Four counters of which 0 is the default. These messages incur lower cost |
|
because data is written directly to the user buffer. |
|
|
Number of messages where payload data was delivered to a buffer on the overflow list |
because there was no match on the priority list. Four counters of which 0 is the |
|
default. These messages incur higher cost because data must be copied from the |
|
overflow buffer. |
|
Compute the ratio |
|
messages for which receives were posted in advance. |
|
|
Number of requests matched on request list (software endpoints). |
|
Number of append commands. |
|
Number of wildcard searches using |
|
Number of wildcard searches using |
|
Number of wildcard searches using |
|
Number of rendezvous puts received. |
|
Number of non-fetching |
|
Number of fetching |
Cassini message matching statistics in events include:
Event |
Description |
|---|---|
Completion events, |
Number of match attempts on priority list |
Completion events, |
Number of match attempts on other lists |
Link events (normally suppressed), |
Number of list entries allocated to pool |
Link events (normally suppressed), |
Number of list entries available to pool |
Example
CxiTranslationUnit - Cassini translation unit counters
The counters in this group are:
Counter Name |
Description |
|---|---|
|
Number of cache misses by counter pool. |
|
Number of translation requests by client (events, writes, reads). |
|
|
|
Note that EE is the Event Engine; IXE is the Input Transfer Engine or Writes; and OXE is the Output Transfer Engine or Reads. |
|
Number of cache misses by client (events, writes, reads). |
|
|
|
|
|
Number of times a tag was evicted from the NIC translation cache to make room for a new tag. |
|
Number of cache hits observed on the Base Page Size. |
|
Number of cache hits observed on the Derivative 1 Page Size. |
|
ATS translation latency in preconfigured bins. |
Example: Two Counter Pools
NIC |
MISS_0 |
MISS_1 |
REQ_IXE |
MISS_IXE |
REQ_OXE |
MISS_OXE |
|---|---|---|---|---|---|---|
0 |
8744 |
0 |
6758637 |
791 |
27033796 |
7951 |
1 |
9973 |
0 |
6758548 |
1957 |
27033657 |
8014 |
2 |
8702 |
0 |
6758435 |
802 |
27033634 |
7898 |
3 |
9970 |
0 |
6758405 |
1927 |
27033608 |
8041 |
4 |
8735 |
0 |
6758440 |
762 |
27033637 |
7971 |
5 |
10053 |
0 |
6758404 |
2021 |
27033604 |
8030 |
6 |
8649 |
0 |
6758435 |
800 |
27033634 |
7847 |
7 |
9441 |
0 |
6758404 |
1405 |
27033604 |
8034 |
CxiLatencyHist- Cassini latency histogram counters
PCT counters included in this counter group provide the:
Number, including the maximum number, of active connects (SCT and TCT)
Number, including the maximum number, of active messages (SMT and MST)
Configurable histogram for response latency
Counters in this group include:
Counter Name |
Description |
Base |
Bin Width |
|---|---|---|---|
|
Request or response latency histogram, 32 bins. |
256 |
128 |
|
Host access latency histogram, 16 bins. |
2,048 |
256 |
Example

The example figure above shows two histograms: One for host accesses (reads) and one for network request/response. The width of the bins (in clock cycles or nanoseconds) is controlled by the base and the M parameter. The bin width is shown as 2^M^. The values were set up in advance. Note also that users cannot configure the histograms without root permission.
CxiPctReqRespTracking - Cassini PCT request and response tracking counters
The counters in this group are:
Counter Name |
Description |
|---|---|
|
Number of ordered requests. |
|
Number of unordered requests. |
|
Number of responses received (all unordered). |
|
Number of open requests. |
|
Number or requests that did not complete because |
the TRS was full. |
|
|
Number of retries. |
|
Number of requests that timed out before a |
response was received. |
|
|
Number of close requests that timed out before |
a response was received. |
The retry handler provides information on its activity in /run/cxi/cxi<device>.
CxiLinkReliability - Cassini link reliability counters
The counters in this group are:
Counter Name |
Description |
|---|---|
|
Number of codewords received with no errors. |
|
Number of corrected codewords. |
|
Number of uncorrected codewords. |
|
Number of replays transmitted. |
|
Number of replays detected. |
Example
NIC |
PCS_GOOD_CW |
PCS_CORRECTED_CW |
PCS_UNCORRECTED_CW |
LLR_RX_REPLAY |
|---|---|---|---|---|
0 |
127888452 |
12 |
0 |
0 |
1 |
127917527 |
1 |
0 |
0 |
2 |
126855057 |
1 |
0 |
0 |
3 |
126843486 |
30 |
0 |
0 |
4 |
127061355 |
5 |
0 |
0 |
5 |
127052551 |
15 |
0 |
0 |
6 |
127680056 |
38 |
0 |
0 |
7 |
127706017 |
1 |
0 |
0 |
- |
- |
- |
- |
- |
CxiCongestion - Cassini congestion counters
The counters in this group are:
Counter Name |
Description |
|---|---|
|
|
|
Number of cycles in which the network asserts pause, per traffic class; default classes for DMA traffic are |
0 and 1. The network asserting pause indicates the application is causing congestion. |
|
|
Number of cycles in which at least one PCP pause occurred. |
|
Number of cycles in which the NIC asserts pause, per traffic class; default classes for DMA traffic are 0 |
and 1. The NIC asserting pause indicates that either the rate of writes or the rate of translations is higher |
|
than the host can support, and the NIC is applying back-pressure to the network. |
Example
     Name                             Samples      Min          Mean            Max
     hni_rx_paused_0                        4        0             0              0
     hni_rx_paused_1                        4        0     396666167   (1586664669)*
     hni_tx_paused_0                        4        0             0              0
     hni_tx_paused_1                        4        0     163578075      654312300
     parbs_tarb_pi_non_posted_pkts          4        0      54988998      201652661
     parbs_tarb_pi_posted_blocked_cnt       4        0     941671854   (3766687419)*
     parbs_tarb_pi_posted_pkts              4      372      46139681      184554415
* - Text in parentheses followed by an asterisk is red text in actual output.
Gathering Cassini performance counters in HPE Cray MPI
The HPE Cray Message Passing Interface (MPI) is HPE’s high performance MPI library, a solution based on standards maintained by the MPI Forum. MPI allows for parallel programming across a network of computer systems by using message passing techniques. In support of this functionality, MPI uses libfabric (OFI), an open source project and a subgroup of the OpenFabrics Alliance, as the default network interface library.
HPE Cray MPI offers a feature to automatically gather and analyze Cassini counters for any MPI application run on the HPE Slingshot 11 network. This easy-to-use feature provides important feedback regarding application performance and requires no source code or linking changes. To gather CXI counters for an MPI job, use the following environment variables at runtime:
MPICH_OFI_CXI_COUNTER_REPORTMPICH_OFI_CXI_COUNTER_FILEMPICH_OFI_CXI_COUNTER_REPORT_FILEMPICH_OFI_CXI_COUNTER_VERBOSE
Important: Avoid using the PAT_RT_PERFCTR and MPICH_OFI_CXI_COUNTER_* environment variables at the same time for an instrumented MPI program. Doing so can result in unexpected runtime issues.
Environment Variable |
Description |
|---|---|
|
Determines if CXI counters are collected during the application and |
verbosity of the counter data report displayed during |
|
By default, HPE Cray MPI tracks |
|
application. The counter data is collected during |
|
|
|
counters over the duration of the application. No interference exists |
|
while the application is running. To obtain a valid counter report, run |
|
times must be at least a few seconds. A |
|
as an event on the Slingshot 11 - network (such as a link flap) that |
|
causes a packet to be re-issued. Network timeouts are identified from a |
|
NIC perspective. A single link flap may affect multiple NICs, depending |
|
on the network traffic at the time, so it is likely a single flap |
|
generates multiple timeouts. MPI queries all NICs in use for the |
|
application. Depending on the application traffic pattern and time, |
|
network timeouts may or may not affect the application performance |
|
metric. If network timeouts affecting the application occur, a one-line |
|
message is sent to |
|
timeouts are detected, this line is suppressed unless additional |
|
verbosity is requested (for example, MPICH Slingshot Network Summary: |
|
3 network timeouts). Along with the network timeout counters, MPI can |
|
also collect and display an additional set of Cassini counters by setting |
|
|
|
a default set of counters it collects for each application, which may be |
|
useful in debugging performance problems. This set can be overridden by |
|
specifying a file with a list of alternate counters. Values 0 through 5 |
|
are options for the |
|
0 - no Cassini counters collected; feature is disabled |
|
1 - network timeout counters collected, one-line display (default) |
|
2 - option 1 + CXI counters summary report displayed |
|
3 - option 2 + display counter data for any NIC that hit a network |
|
timeout |
|
4 - option 2 + display counter data for all NICs, if any network |
|
timeout occurred |
|
5 - option 2 + display counter data for all NICs |
|
Default: 1 |
|
|
Specifies a file containing an alternate list of Cassini counter names |
to collect. |
|
If this file is present, instead of collecting the default set of counters, |
|
MPI collects data for the counters specified in the file. Counter names |
|
must be listed one per line. For retry handler counters, prefix the |
|
counter name with |
|
|
|
|
|
The default network timeout counters is collected in addition to the |
|
file contents. Only applicable to Slingshot 11. |
|
CXI counters that MPI collects by default, if |
|
is not used to specify an alternate set, include: |
|
- |
|
- |
|
- |
|
- |
|
- |
|
- |
|
- |
|
- |
|
- |
|
- |
|
- |
|
- |
|
- |
|
- |
|
- |
|
- |
|
- |
|
- |
|
- |
|
- |
|
- |
|
- |
|
- |
|
- |
|
- |
|
- |
|
- |
|
- |
|
- |
|
- |
|
- |
|
- |
|
- |
|
- |
|
Default: Not set. |
|
|
Specifies an optional output filename prefix for the counter report. |
By default, the counter report is written to |
|
variable is set to a filename, the detailed counter data produced with |
|
|
|
node-specific files with filenames of |
|
|
|
appropriate permission to create these files. This option is useful |
|
if you are running on hundreds or thousands of nodes, where |
|
can become jumbled or truncated by the launcher. If not specified, |
|
|
|
|
If set to a non-zero value, this option enables more verbose output |
about the Cassini counters being collected. This counter is helpful for |
|
debugging and identifying which counters are being collected. |
|
Default: 0 |
Example Summary Report
If set to 2 or higher, the Cassini counter summary report that is displayed during MPI_Finalize includes a minimum/mean/maximum value for each counter selected, along with computed rates. If set to 3 or higher, NIC-specific detailed counter data appears. Counters that record zero values are suppressed. Recognized values are between 0 and 5. The value affects the verbosity of the counter data displayed.
MPICH Slingshot Network Summary: 5 network timeouts
MPICH Slingshot CXI Counter Summary:

Counter                 Samples        Min        (/s)       Mean        (/s)        Max        (/s)
rh:spt_timeouts               4          1         0.1          1         0.1          2         0.2
atu_cache_hit_base_
     page_size_0            508        131        13.1        199        19.9        325        32.5
atu_cache_hit_derivative1_
     page_size_0            508  267137026  26713702.6  267258596  26725859.6  267382810  26738281.0
lpe_net_match_priority_0    508     312194     31219.4     406687     40668.7     491374     49137.4
lpe_net_match_overflow_0    508       3227       322.7      88050      8805.0     182417     18241.7
lpe_net_match_request_0     508         20         2.0         22         2.2         25         2.5
lpe_rndzv_puts_0            508     182182     18218.2     182182     18218.2     182182     18218.2
lpe_rndzv_puts_offloaded_0  508     182182     18218.2     182182     18218.2     182182     18218.2
hni_rx_paused_1             506        405        40.5     150356     15035.6     931673     93167.3
hni_tx_paused_0             508      56056      5605.6   11170254   1117025.4   22860933   2286093.3
hni_tx_paused_1             508   36133827   3613382.7 1217571763 121757176.3 4243430751 424343075.1
parbs_tarb_pi_posted_pkts   508  214956606  21495660.6  215103291  21510329.1  215275997  21527599.7
parbs_tarb_pi_posted_
     blocked_cnt            508    3301944    330194.4    8966220    896622.0   16794528   1679452.8
parbs_tarb_pi_non_posted_
     pkts                   508  213465644  21346564.4  213465928  21346592.8  213466358  21346635.8
parbs_tarb_pi_non_posted_
     blocked_cnt            508        260        26.0       3123       312.3      21554      2155.4
rh:nack_resource_busy        56          1         0.1          1         0.1          3         0.3
rh:nacks                     60          1         0.1         90         9.0        430        43.0
rh:nack_sequence_error       56         14         1.4              95         9.5        427        42.7
All user accessible NIC performance counters
This table includes all Cassini counter events available to users and supported by HPE performance analysis tools using the conventional PAT_RT_PERFCTR environment variable. Specify papi_native_avail -i cray_cassini to view these counters; the perftools modules or papi module must be loaded. Use the papi_component_avail utility to verify if the cray_cassini PAPI component is activated for the compute platform.
Counter Name |
Description |
|---|---|
|
ATS Page Request Services On-Demand Paging latency histogram. Four bins |
defined in |
|
|
ATS Translation latency histogram. Four bins defined in |
|
|
|
Number of cache hits observed on the Base Page Size. |
|
Number of cache hits observed on the Derivative 1 Page Size. |
|
Number of cache hits observed on the Derivative 2 Page Size. |
|
Number of cache misses by counter pool. |
|
Number of times a tag was evicted from the NIC translation cache to make room |
for a new tag. |
|
|
Number of cache misses by client (events, writes, reads). |
|
|
|
|
|
Number of translation requests by client (events, writes, reads). |
|
|
|
|
|
Number of client responses that were not |
|
NIC Page Request Interface On-Demand Paging latency histogram. |
|
NTA Translation latency histogram. |
|
Number of On-Demand Paging requests. |
|
Number of commands of each type: |
|
|
- Put, Get, rendezvous, atomics, small message, Ethernet, and so forth. |
|
- Target commands |
|
- Triggered operations |
|
|
Number of cycles the pool had a command ready to send to OXE and could not |
make progress because another OCUSET won arbitration. |
|
|
Number of successfully parsed CQ commands processed by the CQ block. |
|
Number of successfully parsed DMA commands. |
|
Number of successfully parsed immediate data commands. |
|
Number of successfully parsed CQ commands processed by the CQ block. |
|
The number of error-free low-latency operations received. This counter |
increments whenever counters |
|
|
|
counter is not necessarily equal to the sum of these other three counters, |
|
because counters |
|
increment for the same low-latency operation. |
|
|
The number of low-latency operations received for which the data of the |
operation was not accepted because the corresponding transmit queue was not |
|
empty, or the transmit queues low-latency data buffer was not empty when the |
|
low-latency operation was received. |
|
|
The number of low-latency operations received for which the data of the |
operation was not accepted because delivery of that data was split into |
|
multiple writes to the command issue image, with some or all of those writes |
|
containing less than 64 bytes of data. |
|
|
The number of low-latency operations for which the data of the operation was |
accepted. Barring an uncorrectable error being subsequently detected in the |
|
low-latency data buffer (error flag |
|
accepted is forwarded to the CQ transmit command parser. Each 64-byte or |
|
128-byte block of data written to the command issue image is counted as one |
|
low-latency operation. As each such block of data may contain more than one CQ |
|
command, there is not a one-to-one correspondence between this |
|
|
|
|
Number of PCIe command reads issued for target prefetch queues. Four counters, |
one each for reads of 64, 128, 192, or 256 bytes. |
|
|
Number of successfully parsed CQ commands processed by target command |
queues. All target commands are single flit. Incremented as target commands |
|
are sent to LPE. |
|
|
Number of PCIe command reads issued for TOU prefetch queues. Four counters, |
one each for reads of 64, 128, 192, or 256 bytes. |
|
|
Number of PCIe command reads issued for transmit prefetch queues. Four |
counters, one each for reads of 64, 128, 192, or 256 bytes. |
|
|
Cycles on which target prefetch buffers are empty and pool has read requests |
pending. Note that this counter does not increment on cycles for which commands |
|
in another pool are being processed. |
|
|
Cycles in which transmit prefetch buffers are empty and pool has read requests |
pending. Note that this counter does not increment on cycles for which commands |
|
in another pool are being processed. CQ maintains a count of the number of |
|
command read requests pending for each of the four counter pools. The prefetch |
|
unit increments these counts as a PCIe read is issued and decrement them as they |
|
complete. In cycles for which there is no command to process, the head of the CQ |
|
pipeline increments the |
|
has read requests pending. |
|
|
Number of prefetched address translations. |
|
Number of combining buffers written to an event queue. |
|
Number of event queue buffer switches not performed as soon as requested due |
to insufficient old event queue buffer free space immediately available to |
|
enqueue the buffer switch event. The buffer switch is performed when space |
|
becomes available in the old event queue buffer. Deferred event queue buffer |
|
switches could be an indication that software is waiting too long before |
|
scheduling buffer switch requests. One or more other events are likely to be |
|
dropped when an event queue buffer switch is deferred. Pooled counter, pool |
|
determined by |
|
|
Number of event queue buffer switches performed. Pooled counter, pool |
determined by |
|
|
Number of status updates written to an event queue. Status updates are written |
to report an event queue fill level exceeding a configured threshold and to |
|
report dropped events. Pooled counter, pool determined by |
|
the event queue descriptor. |
|
|
Number of times the event queue software state is updated using a fast path |
write. The rate of increase of this counter relative to |
|
provide an indication of how frequently software is servicing event queues. |
|
Pooled counter, pool determined by |
|
descriptor. This counter does not count every event queue software state fast |
|
path write that occurs if the processing of writes received in quick |
|
succession and targeting the same event queue becomes coalesced in the EEs |
|
event queue state pipeline. This counter does not increment for fast path |
|
writes that target a disabled event queue. |
|
|
Number of flow control state-change full events that were not enqueued because |
the event queue was full. This count also includes events dropped because the |
|
targeted event queue buffer was disabled. This situation should only occur when |
|
software incorrectly configures the event queue descriptor. Pooled counter, pool |
|
determined by |
|
|
Number of full events that were not enqueued because the event queue was full. |
This count includes all dropped full events not included in either |
|
|
|
The sum of all three counters is the total number of dropped full events. |
|
This count also includes events dropped because the targeted event queue |
|
buffer was disabled. This situation should only occur when software incorrectly |
|
configures the event queue descriptor. Pooled counter, pool determined by |
|
|
|
|
Number of full events, subject to an event queue space reservation, which were |
not enqueued because the event queue was full. This count also includes events |
|
dropped because the targeted event queue buffer was disabled. This situation |
|
should only occur when software incorrectly configures the event queue |
|
descriptor. Pooled counter, pool determined by |
|
queue descriptor. |
|
|
Number of full events enqueued to an event queue. This count does not include |
null events ( |
|
code. The EE inserts error-free null events into event queues as needed to |
|
maintain alignment requirements for real (non-null) events. Pooled counter, pool |
|
determined by |
|
|
Number of partially full combining buffers written to their event queue because |
too much time elapsed without additional events arriving to fill the buffer. |
|
Pooled counter, pool determined by |
|
descriptor. |
|
|
Number of partially full combining buffers written to an event queue. A partially |
full combining buffer has room for one or more additional events to be added to |
|
it at the time it is released to be written to the event queue. Therefore, the |
|
end of the buffer is padded with one or more null events. A partially full |
|
combining buffer can be written to the event queue because either the size of |
|
the next event to enqueue is such that, to maintain alignment requirements, the |
|
next event needs to start a new combining buffer, or because too much time has |
|
elapsed without additional events arriving to fill the combining buffer. Note, |
|
this counter does not count combining buffers containing null events (between |
|
real events at the start and end of the buffer) as partially full buffers. |
|
|
Number of packets discarded due to a timeout for each traffic class as indicated |
by |
|
|
Number of LLR replays. High rates (multiple per second) indicate that the LLR |
|
mechanism is providing protection on a poor quality link. |
|
Number of multicast packets with good FCS received by TC. Multicast is indicated |
when DMAC bit 40 is set and DMAC is not all 1s. |
|
|
Number of multicast packets with good FCS sent by TC. Multicast is indicated |
when DMAC bit 40 is set and DMAC is not all 1s. |
|
|
Number of pause frames received for each enabled PCP (as identified by the PEV |
field of the pause frame) when PFC pause is enabled. Reception of a standard |
|
pause frame causes all counts to increment. |
|
|
Number of pause frames sent where |
pause is enabled. Transmission of a standard pause frame causes all counts to |
|
increment. |
|
|
Number of corrected codewords. |
|
Number of errors in each FECL. |
|
Number of codewords received with no errors. |
|
Number of uncorrected code words received on the switch to NIC link. High rates |
(multiple errors per second) indicate a poor quality link. |
|
|
Number of packets discarded at the tail of the PFC FIFO. This can happen when |
the MFS setting is exceeded for that traffic class or the FIFO is nearly full. |
|
This equates to each time the PFC_FIFO_OFLW error flag sets for a particular TC. |
|
|
Number of packets received by traffic class |
are 0 for request and 1 for response. |
|
|
Number of packets sent by sent by traffic class |
classes are 0 for request and 1 for response. |
|
|
Number of packets received in each of 12 size bins. |
|
Number of cycles in which the pause is applied on the receive path for traffic |
class |
|
the network is supplying data faster than this endpoint can consume it. Divide by |
|
1E9 to determine the proportion of time paused. |
|
|
Number of system clocks for which the Rx path of the corresponding traffic class |
is stalled due to lack of space in the IXE Packet Buffer. |
|
|
Number of packets sent in each of 12 size bins: |
- Small packets 27, 35, 64 bytes |
|
- 65-128, 256-511, 512-1023, 1024-2047, 2048-4095, 4096-8191, 8192-Max |
|
|
Number of cycles in which the transmit path is paused for traffic class |
default classes are 0 for request and 1 for response. Indicates that this endpoint |
|
is supplying data faster than the network can deliver it. Divide by 1E9 to |
|
determine the proportion of time paused. |
|
|
Number of requests to DMA write controller. |
|
Number of stalls due to no posted credits (cycles). |
|
Number of stalls due to no non-posted credits (cycles). |
|
Number of packets with ECN set. One counter for each of the four pools of PtlTEs. |
|
Number of packets without ECN set. One counter for each of the four pools of |
PtlTEs. |
|
|
Number of memory read TLPs (all source). |
|
Number of memory write TLPs (all source). |
|
Number of request packets with ECN set, by TC. |
|
Number of request packets without ECN set, by TC. |
|
Number of response packets with ECN set, by TC. |
|
Number of response packets without ECN set, by TC. |
|
Number of |
|
Number of |
of the four pools of PtlTEs. |
|
|
Number of cycles in which a PE Match Request Queue dequeue was blocked |
because a Ready Request Queue was full. One counter for each of the four PEs. |
|
|
Number of network requests LPE successfully matched to locally managed |
buffers. One counter for each of the four pools of PtlTEs. |
|
|
Number of messages where payload data was delivered to a buffer on the |
overflow list because there was no match on the priority list. Four counters of |
|
which 0 is the default. These messages incur higher cost because data must be |
|
copied from the overflow buffer. |
|
Compute the ratio |
|
messages for which receives were posted in advance. |
|
|
Number of messages matched on the priority list (that is, receive was posted |
before the message arrived. Four counters of which 0 is the default). These |
|
messages incur lower cost because data is written directly to the user buffer. |
|
|
Number of requests matched on request list (software endpoints). |
|
Number of requests matched. |
|
Number of network requests LPE successfully completed. One counter for each of |
the four pools of PtlTEs. |
|
|
Number of network requests LPE successfully matched to use-once buffers. One |
counter for each of the four pools of PtlTEs. |
|
|
Number of truncated packets. One counter for each of the four pools of PtlTEs. |
|
Number of rendezvous puts received. |
|
Number of Rendezvous Puts that LPE was able to offload. One counter for each of |
the four pools of PtlTEs. |
|
|
Number of wildcard searches using |
|
Number of wildcard searches using |
|
Number of wildcard searches using |
|
Number of |
pools of PtlTEs. |
|
|
Number of successful |
pools of PtlTEs. |
|
|
Number of Get and AMO packets that match on Overflow or Request, resulting |
in |
|
|
Number of AXI read requests received at the CMC channels. |
|
Number of AXI write requests received at the CMC channels. |
|
Number of CRMC AXI read requests. |
|
Number of CRMC AXI write requests. |
|
Number of CRMC read errors. |
|
Number of CRMC ring in multi bit errors. |
|
Number of CRMC ring out read requests. |
|
Number of CRMC ring in single bit errors. |
|
Number of CRMC ring out write requests. |
|
Number of CRMC write errors. |
|
Number of cycles in which available bandwidth is not used. |
|
Number of flits sent by each MCU (configurable to count packets or messages). |
|
Number of portal Get messages sent by traffic shaping class. The following OXE |
pkt types ( |
|
To be counted in the MCUOBC. |
|
|
Number of clocks a TSC is not allowed to participate in traffic shaping |
arbitration because it is waiting for outbound shaping tokens. One counter for |
|
each TSC. |
|
|
Number of portal packets by traffic shaping class. Counted either in the MCUOBC |
after the MCU is granted or at the traffic shaper after packet is selected. |
|
|
Number of cycles blocked for FGFC (matching entry exists and Credit >=0). Index |
given by |
|
|
Number of cycles blocked for FGFC (matching entry exists). Index given by CSR |
|
|
|
Number of FGFC frames received with matching VNI that end FGFC (period == 0). |
Index given by CSR |
|
|
Number of FGFC frames received with matching VNI that start or continue FGFC |
(period != 0). Index given by CSR |
|
|
Number of cycles IDC command is enqueued (into ENQ FIFO) but cannot get |
buffer. Counted per BC. This is an OR of all MCUs belonging to the same BC |
|
with an IDC command but does not have a cell (buffer) allocated. |
|
|
Number of clocks a BC is not allowed to participate in MCUOBC arbitration |
because it is waiting for packet buffer resources. One counter for each BC. |
|
Count in |
|
|
Number of clocks a BC is not allowed to participate in MCUOBC arbitration |
because it is waiting for PCT resources. One counter for each BC. Count in |
|
|
|
|
Number of clocks a TSC is not allowed to participate in traffic shaping |
arbitration because it is waiting for inbound shaping tokens. One counter for |
|
each TSC. |
|
|
Number of clocks a TSC is not allowed to participate in traffic shaping |
arbitration because it is waiting for outbound shaping tokens. One counter for |
|
each TSC. |
|
|
Number of cycles header write or IDC write collides with PCIe data return. Per |
bank of Packet buffer. |
|
|
Number of PCIe packets transferred using the posted path (for example, writes), |
|
and the number of cycles in which this path is blocked. Compute the ratio |
|
|
from the host. This endpoint is likely to be the cause of congestion. |
|
|
Number of PCIe packets transferred using the non-posted path (for example, |
|
reads), and the number of cycles in which this path is blocked. Compute the |
ratio |
|
host performance (high read latencies). This endpoint is likely to be injecting |
|
at a low rate. |
|
|
Number of open requests. |
|
Request/response latency histogram, 32 bins. |
|
Number of resource exhaustion NACKs. Retry handler is invoked. |
|
|
|
|
|
Number of ordered requests. |
|
Number of unordered requests. |
|
Host access latency histogram, 16 bins. |
|
Number of responses received (all unordered). |
|
Number of retries. |
|
Number of response timeouts (or packet loss in the network). Retry handler is |
invoked. |
|
|
Number of response timeouts, (packet loss in the network). Retry handler is |
invoked. |
|
|
Number of NACKs dropped. Retry handler is invoked. |
|
Number of the successfully validated commands in |
counter array is equal to the OpCode. |
|
|
Number of list CT list rebuilds. Pooled counter, pool is equal to the PFQ number. |
|
Number of triggered commands. Pooled counter, pool is equal to the PFQ number. |